


Technical & On-chain analysis. Is Ether the new king?
Today we analyze BTC, ETH, LUNA and SOL

Dear tokeners
Today in 42 we bring you two spectacular analyzes from two great analysts, one from the point of view of what is happening within the blockchain, and the other technically analyzing the graphs. Draw your own conclusions.

On-chain Analysis of BTC & ETHER
Who should be the king?
Before starting the analysis, I want to share a thought (which may have its detractors). The reason we continue to analyze Bitcoin's On-Chain metrics is because we need to understand the behavior of the industry's benchmark cryptocurrency, which currently holds 41% of the global market capitalization versus a 20% capitalization of Ethereum, leaving 39% for all the others, as you can see in the graph below.
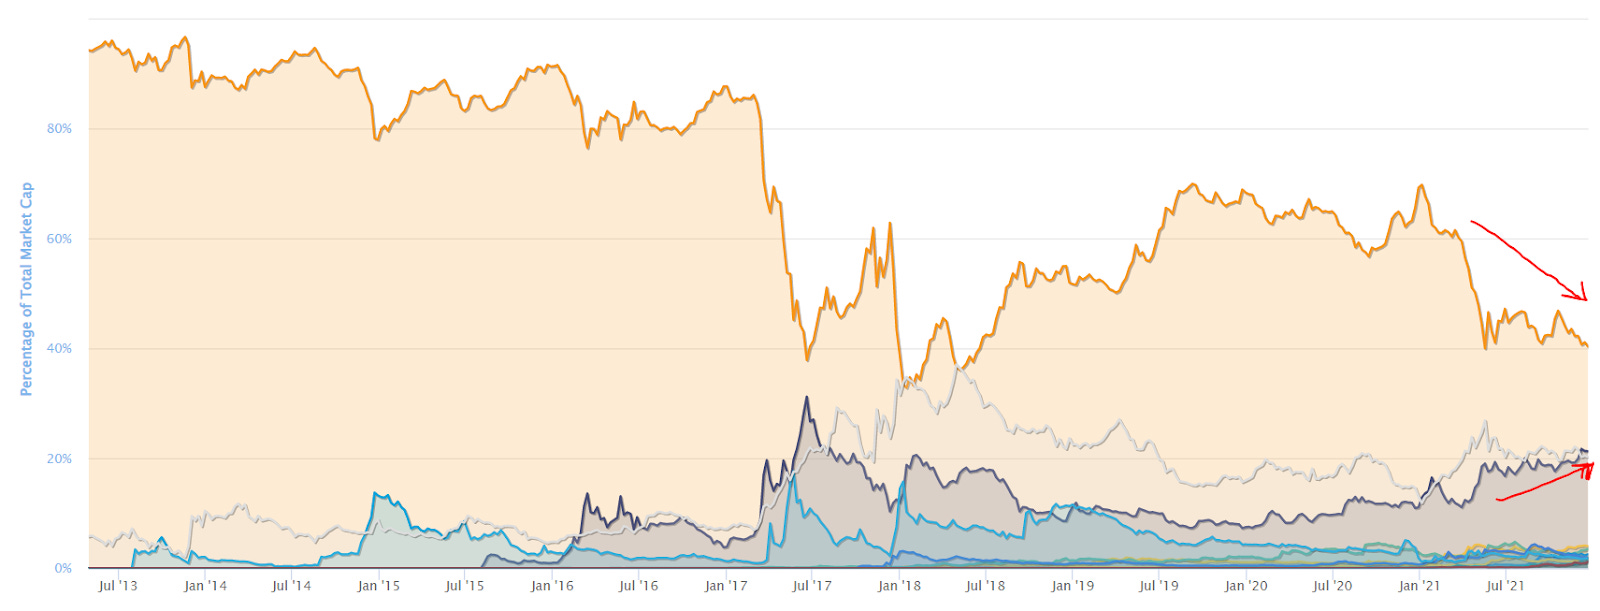
This very high percentage of a single cryptocurrency in the global cryptocurrency market share exposes all underlying protocols, businesses and startups (especially reputational and market risk) to fundamental risks whose tokens and their price are too impacted by movements in the capitalization of Bitcoin, which makes it very very difficult to consider investing in Value in this ecosystem (with the premise that Bitcoin is still a highly speculative asset).
Even so, for us, who propose our strategies in the long term and in tokens that we consider to meet the value attributes, it requires us to understand what is happening within the Bitcoin Blockchain in relation to its "Stakeholders" (speculators, exchanges, miners, developers, holders, etc). The survival of Bitcoin as an asset depends a lot on the incentives to maintain Bitcoin as a Reserve of Value and that at the same time, a decrease in its capitalization does not destroy value to the rest of the alternative protocols and blockchains of the industry, taking everyone ahead the other Stakeholders that are not invested in the Bitcoin network.
Within the above reasoning, we are firm believers that the cryptocurrency that will end up taking the throne from Bitcoin in capitalization is Ether, native to the Ethereum network. This event is called by the ecosystem as “Flippening” and is based mainly on the substantial difference in the attributes of both cryptos (Bitcoin is “Sound Money” while Ether is “Ultra-Sound Money). More info about these concepts in the following link: https://bit.ly/3sm2eys
Our vision is oriented to the generation of value for all those who want to bet on this industry and the protocols that provide employment and wealth to people globally. This means that Bitcoin cannot continue to be the benchmark in value in the industry, because then the speculative component would continue to dominate and this is precisely the closest thing to the casino.
On the contrary, if Ether became the reference, the proposals already implemented by the network have managed to turn Ether into a true Reserve of Value, which would protect the rest of the ecosystem from pure speculation and would give each protocol the opportunity to demonstrate if your Token is invertible or not, considerably reducing the market risk.
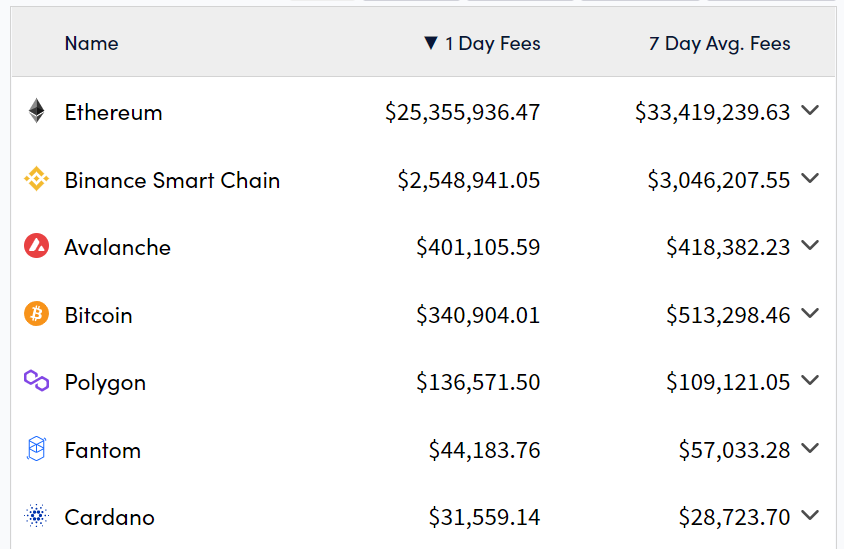
We only have to see the enormous differences in billing between the two Blockchains, where Ethereum generates daily in network commissions (not counting the subsidy for the discovery of new blocks) an average of $ 30 million against the $ 500 million that validators earn on the network of Bitcoin on a daily average.
If we go to the number of daily transactions and see what each transaction generates on the network, in the case of Ethereum, an average of 1.1M daily transactions are taking place, offering a value of $ 27 per transaction to validators, while in the case of Ethereum Bitcoin network is offering a value of $ 2.5 per transaction to validators.
Logically, if we are based on Game Theory, the Ethereum network offers greater incentives for Stakeholders than the Bitcoin network offers. This represents a risk of capital transfer to the Ethereum network that could deteriorate confidence in Bitcoin and the industry in general.


Despite the above, we will continue to report on our vision of what is happening with the Bitcoin network, although we will continue to monitor the relationship between the two cryptocurrencies described.
As an important fact, the miners in the Bitcoin network are generating historical lows in commissions within the network, which leads to (1) maintaining and generating a moving effect to other blockchains or (2) little congestion and sustainability in network revenue.
We can see in the FRM how the miners are more free from validating transactions and most of their income comes from the discovery of blocks. This presumes a risk for Bitcoin, since the same miners will eventually seek settlement of their rewards and will do so BEFORE THE HALVING (Reasoning: If the network commissions do not cover the fixed maintenance costs of the physical miners and from the next Halving they will subtract Half the rewards, I lose incentives to keep my miners incentives after Halving in 2024).
This further substantiates the need for the industry to delink itself from the Bitcoin listing as soon as possible if the same thing that happened in 2018 is not to happen. The loss of confidence would be disastrous for the sustainability of already built ecosystems (DeFi, GameFi , Metaverse, etc).


From a technical point of view, we must start from the basis that the majority of speculators operating only using Technical Analysis, which generates an initial predisposition to give a lot of weight to failures that we detect in high temporal spaces (since more investors and speculators will have time to check the charts as well).

Looking at the Bitcoin chart, we see up to two Hidden Divergences against the RSI indicator (we have also detected them in MACD, which gives more strength to the vision). These types of signals usually tell us that the price does not have enough strength to go against the trend (in this case bullish), which means that sooner or later, technical analysts think that there will be new attempts to rise to the maximums. historical.
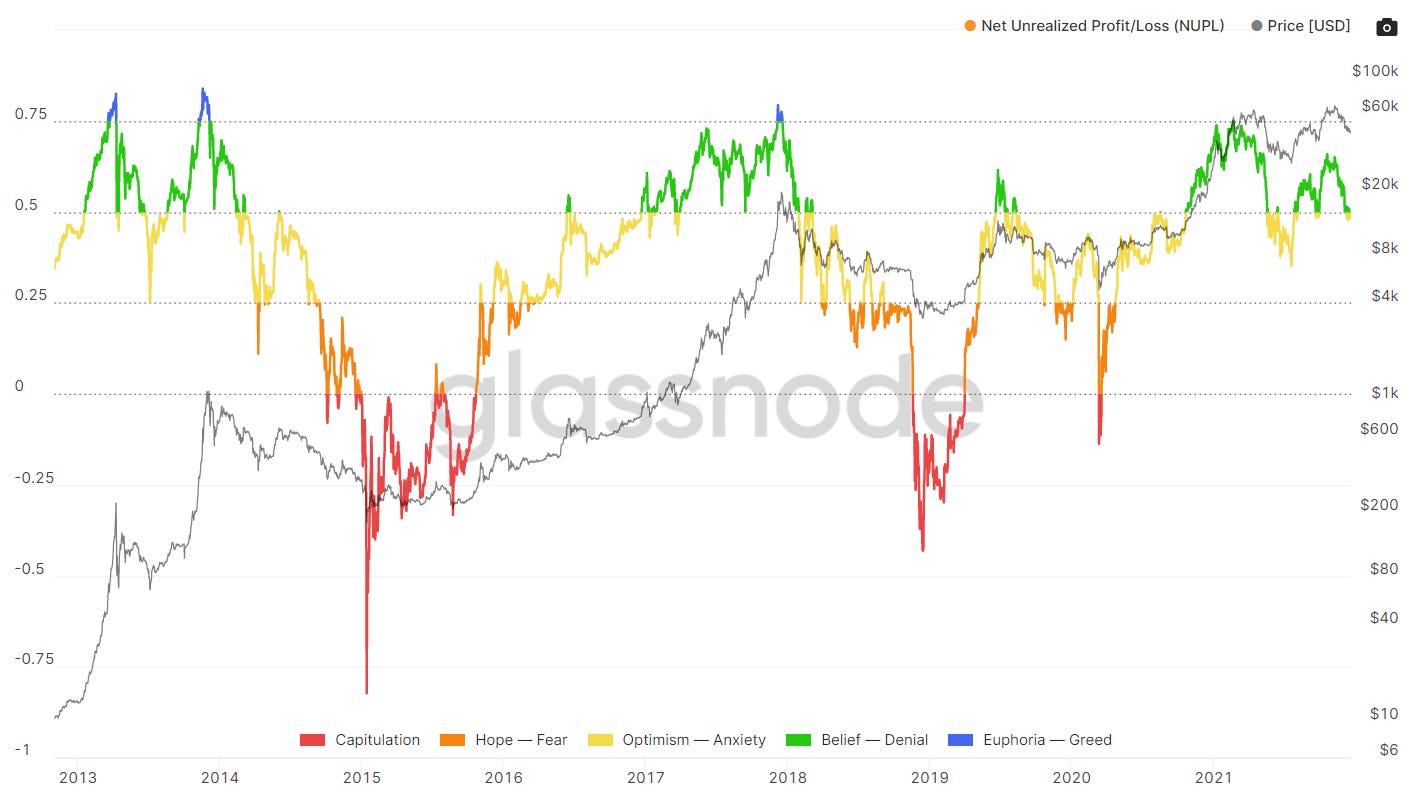
Before analyzing the liquidations of Futures Traders, we are interested in knowing which wallets have shed their Bitcoins in losses. Reviewing the graph below, we can see that the ratio of movements in losses has been enough to mark a potential bottom in the correction, as happened in June-July 2021.

Meanwhile, it appears that the rest of Holders, despite being in losses, are holding onto conviction about a bullish return for Bitcoin to previous highs. Each correction since 2018 means fewer holders in unrealized losses, which suggests that if the price returns to its upward path, it will have very few obstacles in its rise (since the psychology of those who are losing tends to want to recover the investment initial at the point they entered).

If we go to the Ethereum graph, as is logical, we see convergences in RSI, confirming that Ethereum is NOT in a start of a medium-placist downtrend, but in a correction (pullback) to continue its current uptrend.

Analyzing the ETH / BTC Ratio, a clear winner is observed with Ether gaining ground to Bitcoin in value and with objectives of reaching a Ratio of 0.1 in the short term and 0.16 in the medium / long term (where the Flippening).


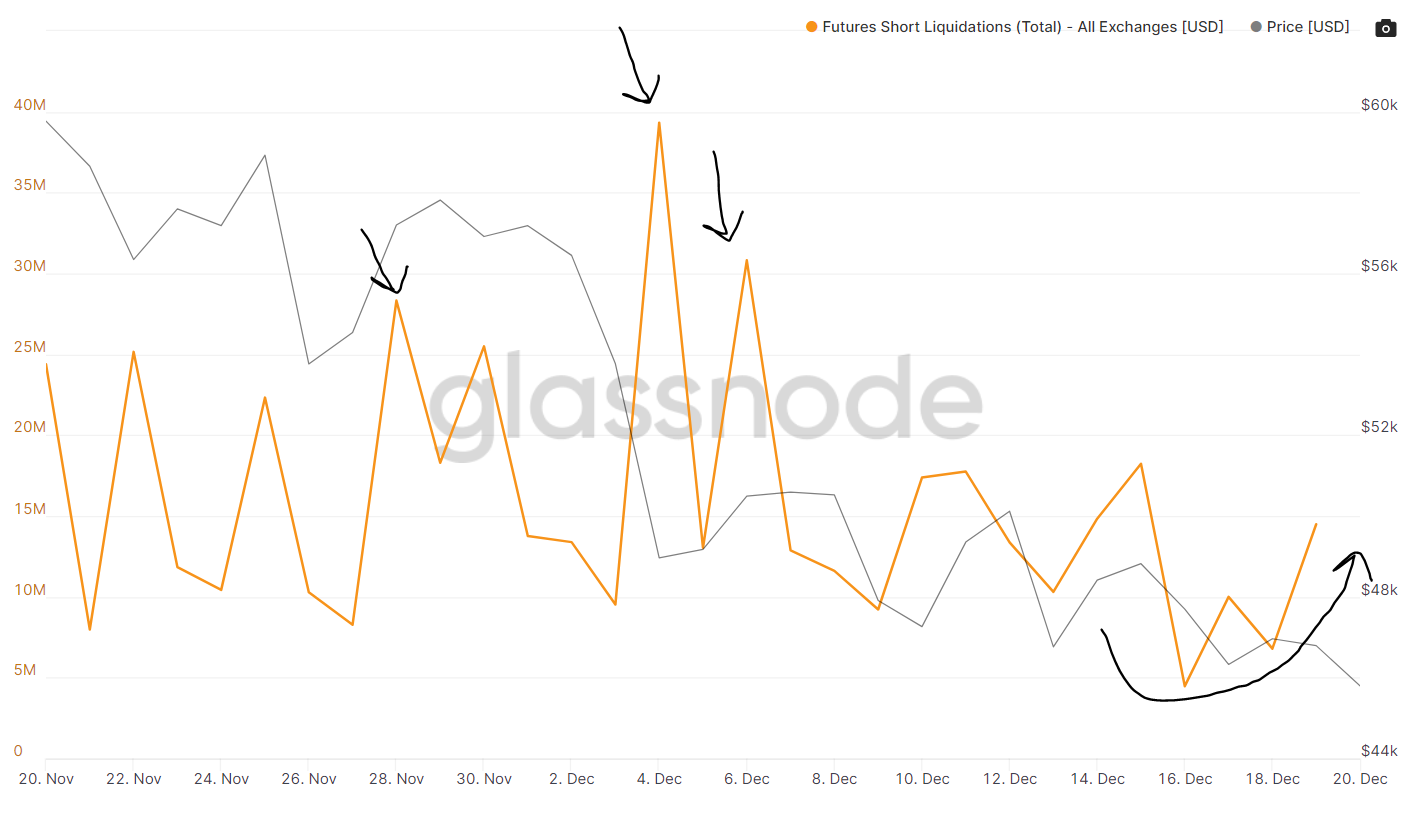
Analyzing the Bitcoin On-chain data, we first see the long sell-offs in Bitcoin Futures, where it appears that speculators' conviction still holds despite the recent sell-off on December 3 (which has not generated a huge impact). on the depreciation of Bitcoin).

However, short liquidations are beginning to give us clues that the vision we have shown above could be fulfilled and consequently propel Bitcoin (and perhaps the rest of the ecosystem) to an increase in the price of all crypto assets.

Even so, the market sentiment of speculators is still somewhat pessimistic, data that for us is very positive given the price of Bitcoin and Ethereum, which remain. The time of fear is when the best investors and speculators accumulate. Still, looking at this data, we see that Futures Traders do not consider the Ethereum price drop and the rest to be over (perhaps too much conviction about Bitcoin).

We observe that the interest rates in FTX futures are the most disparate, implying that there are all the Traders operating the fall.

The conviction that Ether will outperform Bitcoin still has mixed feelings among speculators (not holders).

The number of wallets with more than one Bitcoin has increased, suggesting that retailers are seizing the opportunity to enter the market (or average lower). We know they are not the wholesalers (whales) because wallets with more than 10 BTC are on the decline.


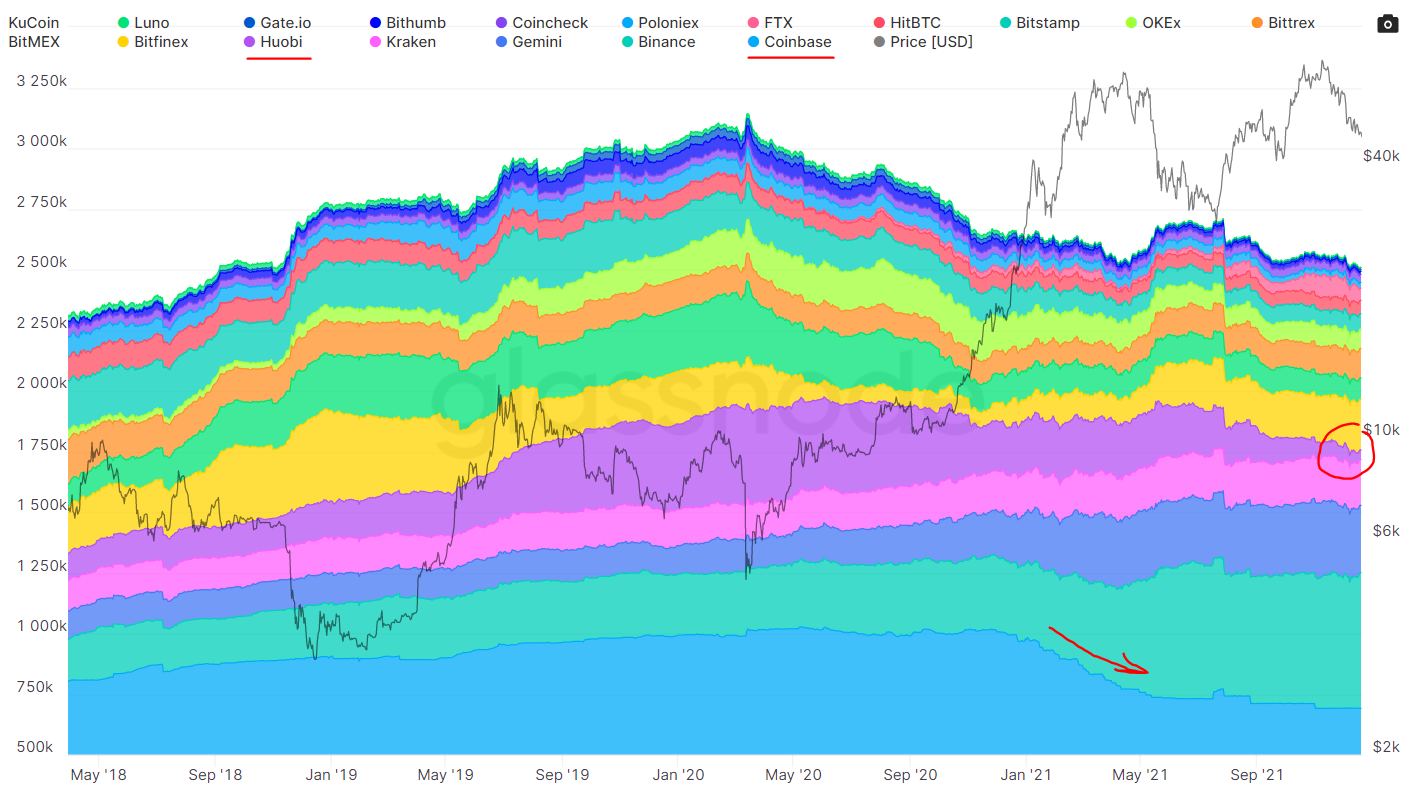
Exchanges are releasing many of their Bitcoin reserves, selling more than buying, which has generally been a buy signal except for the last all-time highs.
The two exchanges that have released their Bitcoin holdings the most have been Coinbase and Huobi. Kraken, Gemini and Binance are kept in their reserves. The liquidations of these two exchanges may have been part of the reason for this latest correction.
We could understand this as part of the strategy of these Exchanges to reduce their exposure to Bitcoin and increase their (diversified) holdings of native cryptocurrencies from other Blockchains. If this is the case, the most important thing then will be to review a potential return of the uptrend of Bitcoin, if Binance, Gemini and Kraken begin to reduce their holdings (and assess if they increase those of others).

Conclusions
More and more we begin to see how our On-chain analysis of Bitcoin yields less information on its own and we need to compare the behavior in other networks to understand the market incentives regarding investment in the cryptocurrency and token industry.
Bitcoin has less and less traction to the detriment of Ethereum, which is attracting the attention of investors in the long term, also thanks to its PoS proposal for 2021. We will closely monitor the relationship between the two crypto assets.
Crypto Technical Analysis
In this weekly article we will try to offer a clear vision of the key levels of the analyzed cryptocurrencies, according to a criterion of technical analysis and volumetric analysis, to offer concrete help to all those who work in the world of cryptocurrencies. This week we will analyze BTC, SOL and LUNA.
BTC / USD analysis

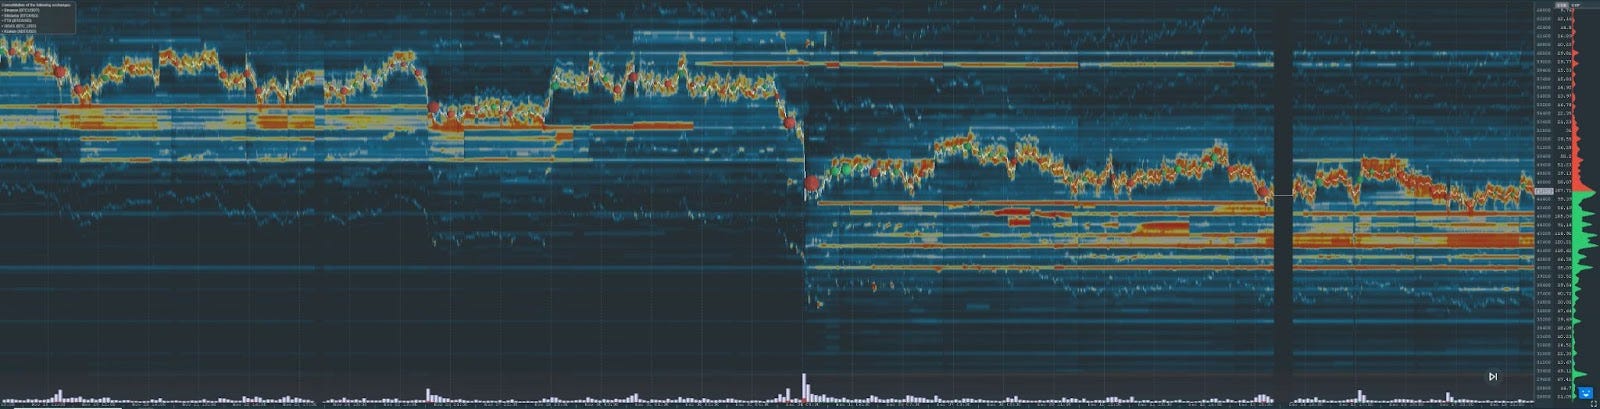
There are no relevant changes compared to last week. The 50,000 area is still a resistance and only the break of 54,400 would give a big bullish signal with area targets 60,000-63,000 and then 71,000. There is a lot of liquidity in the 44,800 and especially in the area of 43,200-41,600. This last zone, if lost, can quickly hit 40,000 and then 36,000 in a single session, potentially changing the trend.
Typically, the longer the price stays in the volumetric zone, the more likely there is to see a powerful trend. However, we advise not to expose yourself too much to the upside, because if those large areas of liquidity are touched and the price does not reverse immediately, the crash may be much deeper than the one in early December. For now we await volumetrically confirmed signals.
Possible operating strategy: short below 44,000 with a target of 41,600; If it breaks out strongly, increase the target short positions 40,000 and 36,000. In the event that prices retrace in a V shape or very rapidly, close shorts and open longs immediately. Long above 50,400 with a target of 54,400. Increase long positions above that level and after 60k. If the 50,000 area were to be rejected, go hunting for shorts.
SOL / USDT analysis
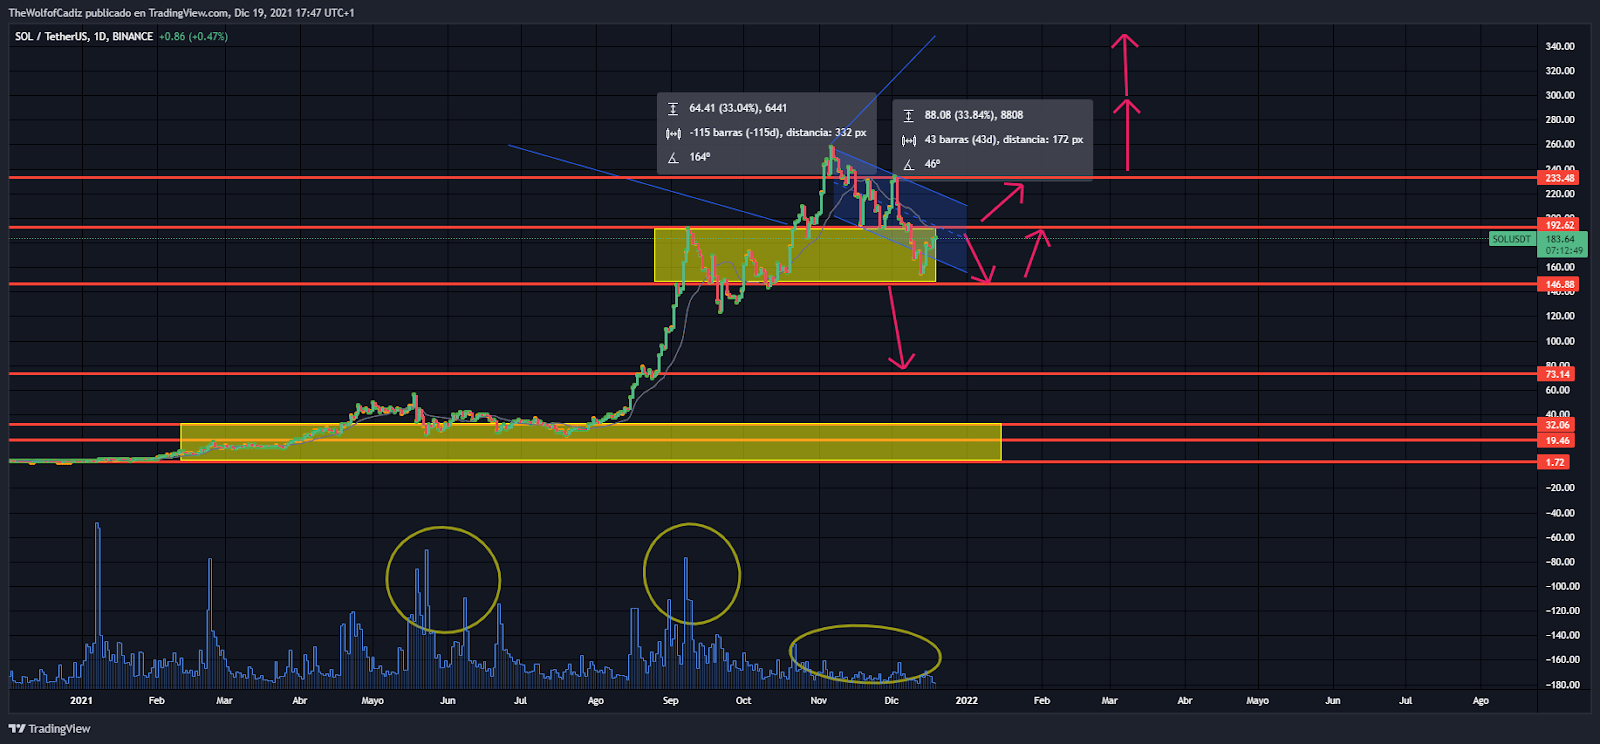
Solana has seen the price hold, for now, in a zone with strong volumetric support at the 192-146 area. Recovering the upper part of the range would favor an attack on the volumetric resistance located at 233. From there, we recall that there is a possibility of a 30% extension, similar to the previous one, targeting the 300-340 area.
A break to the bottom of the range at 146 opens the door for a deep drop; the price could look for an intermediate zone between 123 and 109. If there was no sign of recovery, Solana could see support 73, but that could only happen in the case of massive sales throughout the crypto market.
Although the trend remains bearish on weekly candles, there are no signs of a trend reversal or acceleration. However, it is imperative to look at the price action at the extremes of the 192-143 range, because that will be where we will have trend signs.
LUNA / USD analysis
Terra, a blockchain protocol focused on stablecoins, has two cryptocurrencies: the LUNA token and the UST stablecoin. The LUNA token is used as collateral to achieve price stability for the UST stablecoin. Unlike other stablecoins, such as Tether, whose price is directly pegged to the dollar, the Terra platform uses an elastic monetary policy to maintain the stability of its cryptocurrency.
The price of LUNA, the cryptocurrency on the Terra blockchain, has seen an incredible 1,400% growth in the last 5 months. At the end of July, its price did not reach 5 dollars, now it is worth more than 70 dollars. Terra was born with the objective of creating a blockchain that would promote electronic commerce through stablecoins. Its recent growth is related, above all, to the two DeFi protocols launched in the last year: Mirror Protocol and Anchor Protocol.
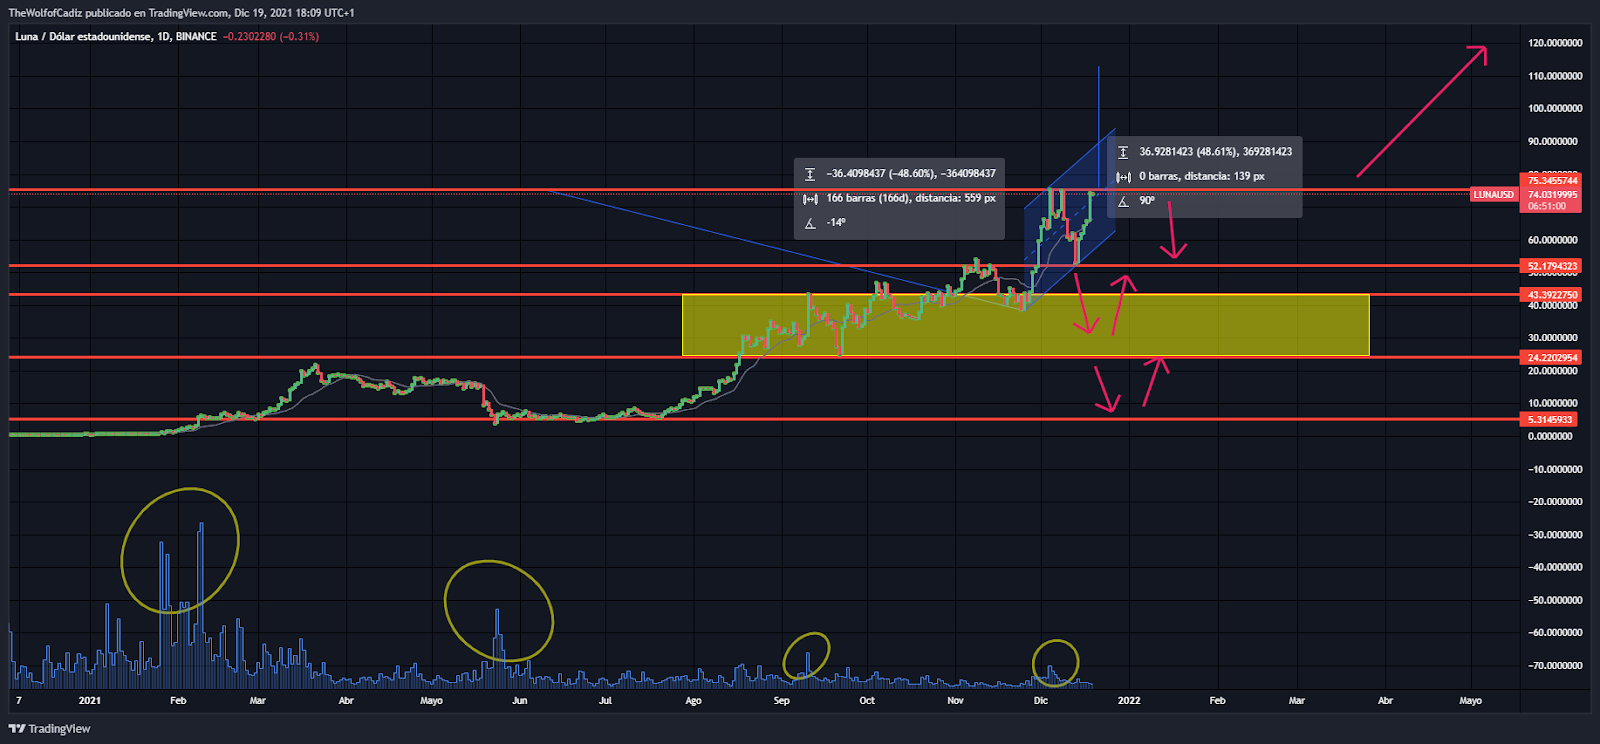
Since the end of July there has been a strong upward trend on LUNA. Between August and November the price has seen a good volumetric accumulation in the 24-43 zone. The preceding accumulation in February and May was a preparatory signal for the big rise.
At the end of November, the break in area 52 has led to a new all-time high at 74. After a very brief pullback, the price is parking in the same area, preparing a new break and new highs.
Calculating the previous movement of almost 50 percent, it is possible to see an extension of the price between 100-120 in case of a new break, especially if there were volumes that accompanied the price.
In conclusion
As the volumes and transactions in derivatives continue to decline since May, the influence on the prices of the derivatives themselves is reduced.
At the same time, however, the spot market remains dormant, to the point of not being able to produce even a "panic sell".
Therefore, derivatives cannot pass the baton as a leader in price developments.
Result: the stagnant market is still influenced by derivatives, although of little importance in terms of volumes. The latter continue to move prices with apparent and meaningless trends.
Until there are clear signs, it is better to wait patiently. The next two weeks, following the seasonality, can bring us many surprises.
We love to collect all opinions and points of view. Do you want to collaborate with us? Write to us at subscribers@betoken.capital.
Do you want to know us more?
Disclosure:
Authors may own funds and asssets mentioned in this newsletter. For more information, visit beToken.
beToken my Friend, beToken's newsletter, is intended for informational purposes only. It is not intended to serve as investment advice. Consult with your investment, tax or legal advisor before making any investment decision.
Advertising and sponsorship do not influence editorial decisions or content. Third-party advertisements and links to other sites where products or services are advertised are not endorsements or recommendations by beToken.
beToken is not responsible for the content of the advertisements, the promises made or the quality or reliability of the products or services offered in any third party advertisement.
If you liked this content on beToken my Friend, why don't you share it?