

Order Flow Technical Analysis
Order Flow Technical Analysis
ETH, CELO and ATOM

This week we will analyse 3 very interesting projects: ETH: the main layer 1 in the industry, secondly the internet of block chains (ATOM) and lastly the global payment infrastructure for crypto payments on a mobile phone- CELO.
Ethereum (ETH)
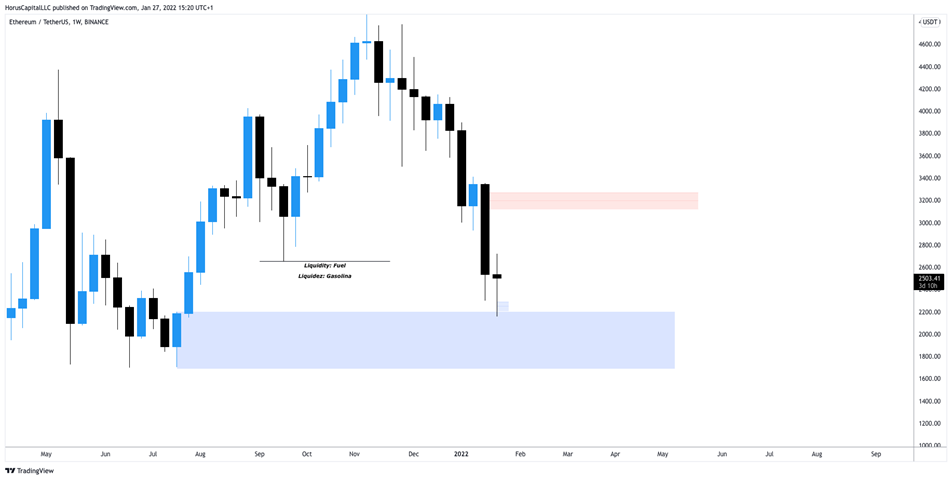
Weekly Chart
On the weekly chart we see a mitigation of institutional orders in the demand area.
The demand point has a liquidity level above that was absorbed so that the institutions can accumulate orders.
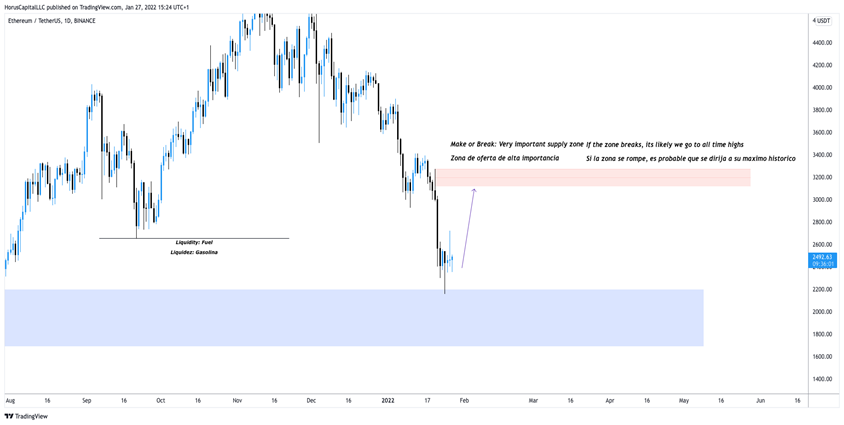
Daily Chart
On this chart we see a possible rally into the supply zone. If this supply zone breaks, we are likely to see all-time highs in the near term. Otherwise, ETH could head for $1,500.
4H Chart
A trend reversal was possibly generated to start a short-term uptrend until the supply zone.

CELO (CELO)
Daily Chart
On the daily chart we can see how the price is breaking the low that mitigated the $3 demand zone and also the internal liquidity to be taken down, so it is likely that price will go to the $2 zone.

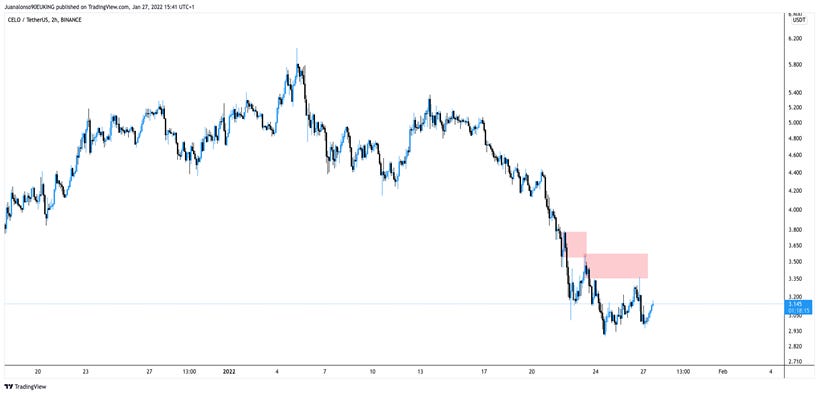
2H Chart
In the 2H chart we can see a fairly bearish flow of orders and how the supply chain has been respected. In the event that this supply chain is broken, we could expect an appreciation in price to the $4-5 zone where there is a strong supply zone.
Cosmos (ATOM)
Daily Chart
ATOM has been one of the most resilient crypto assets on the market downturn. The demand zones are being respected and very soon we are likely to see an all time high.

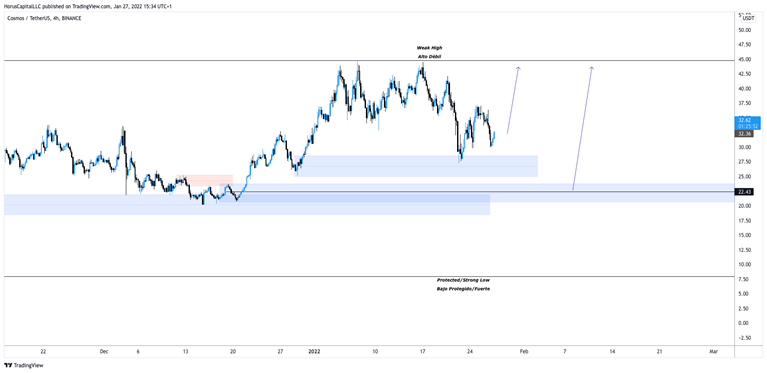
4H Chart
The 23 USD demand zone is offering a great long opportunity to hold for the next 6 months.
Notes
Liquidity has to be absorbed from one side of the market so that it can move to the opposite side with momentum (polarities: Buy Side liquidity and Sell Side Liquidity). For this reason, our strategy is based on understanding and locating liquidity when the price is close to the demand and supply zones to determine the probability that the zones will react.
Terminology used
Choch: Change of Trend.
BOS: Significant structural breakdown.
Demand Zone: Its origin begins with a downward liquidity intake (Lows / Supports / Trend Line) and subsequently an upward momentum arises that breaks structural levels.
Supply Zone: Its origin begins with an upward liquidity intake (Highs / Resistances / Trend Line) and subsequently a bearish momentum arises that breaks structural levels.
Liquidity: Supports, Resistances or Trend Lines.
Structure: A high that produces a significant low or a low that produces a significant high.
ZenTradingLab

ZTL is the strategic space of a traders formation in three dimensions: analytical, emotional control and assertive wisdom (trading in the zone). Reaching the zone requires a physical training and mental training performance based on "anthropomaximology" , the science of maximum human performance.
If you wish to try a zen power training session please don't hesitate to contact us.
We love to collect all opinions and points of view. Do you want to collaborate with us? Write to us at subscribers@betoken.capital
Do you want to know us more?
Disclosure:
Authors may own funds and assets mentioned in this newsletter.
beToken my Friend is intended for informational purposes only. It is not intended to serve as investment advice. Consult with your investment, tax or legal advisor before making any investment decision.
Advertising and sponsorship do not influence editorial decisions or content. Third-party advertisements and links to other sites where products or services are advertised are not endorsements or recommendations by beToken.
beToken is not responsible for the content of the advertisements, the promises made or the quality or reliability of the products or services offered in any third party advertisement or content.
If you liked this content on beToken my Friend, why don't you share it?