

Order Flow Technical Analysis
Order Flow Technical Analysis
DOT, CELO and MATIC

This week we will analyze 3 very interesting projects: The decentralized DOT layer 1, the platform to use Dapps from your mobile called Celo and finally Matic, the layer 2 that recently announced the opening of Uniswap on its platform.
Polkadot (DOT)
Daily Chart
DOT recently reversed trend on the 4H chart. After filling in a significant demand level that previously drew liquidity, Layer 1 reacted with a bullish "pattern".
The 35-39 USD bid zone is the first "pit-stop". In this area there is a high probability of a small setback, and then continue its upward trend to its all-time highs.
Our analysts see USD 125-150 as a target in the next 6 months.

4H Graph

CELO (CELO)
Daily Chart
Celo is currently in a demand zone that produced a higher high.
Demand zones are currently breaking supply zones, which represents the optimism of financial institutions to continue the bull market at least in the short term.
Our analysts see a high probability for CELO to rise to its all-time high.

4H Graph

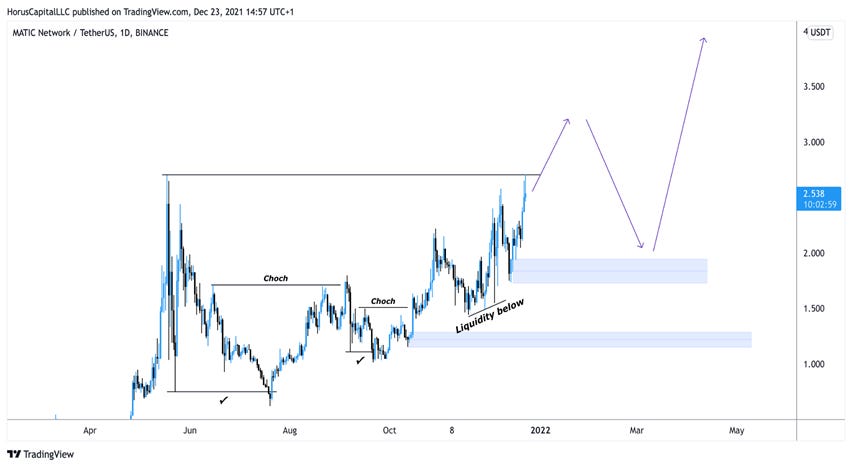
Polygon (Matic)
Daily Chart
Polygon is nearing its all-time high after Uniswap, a decentralized exchange, announced the opening of its platform on Polygon.
Technically, Matic has a high probability of breaking his all-time high. However, in the demand zone of the 4H chart, a batch of institutional orders can be observed that will serve to break the all-time high.
Finally, Matic could return to the demand zone of the daily chart (1.25 USD), where it would attack the liquidity of 1.50 USD. This scenario would be the most sustainable for a long-term uptrend.
4H Graph

Grades
Liquidity has to be absorbed from one side of the market so that it can move to the opposite side with momentum (polarities: Buy Side liquidity and Sell Side Liquidity). For this reason, our strategy is based on understanding and locating liquidity when the price is close to the demand and supply zones to determine the probability that the zones will react.
Terminology used
Choch: Change of Trend.
BOS: Significant structural breakdown.
Demand Zone: Its origin begins with a downward flow of liquidity (Lows / Supports / Trend Line) and subsequently an upward momentum arises that breaks structural levels.
Supply Zone: Its origin begins with an upward liquidity intake (Highs / Resistances / Trend Line) and subsequently a bearish momentum arises that breaks structural levels.
Liquidity: Supports, Resistances or Trend Lines.
Structure: A high that produces a significant low or a low that produces a significant high.
ZenTradingLab

ZTL is the strategic space for training the trader in three dimensions: analytical, emotional control and assertive wisdom (trading in the zone). Reaching this level involves high precision physical training and internal training based on anthropomaximology research, the science of maximum human performance, applied to the skills of the trader, taking him beyond mere knowledge.
We love to collect all opinions and points of view. Do you want to collaborate with us? Write to us at subscribers@betoken.capital
Do you want to know us more?
Disclosure:
Authors may own funds and assets mentioned in this newsletter. For more information, visit beToken.
beToken my Friend, beToken's newsletter, is intended for informational purposes only. It is not intended to serve as investment advice. Consult with your investment, tax or legal advisor before making any investment decision.
Advertising and sponsorship do not influence editorial decisions or content. Third-party advertisements and links to other sites where products or services are advertised are not endorsements or recommendations by beToken.
beToken is not responsible for the content of the advertisements, the promises made or the quality or reliability of the products or services offered in any third party advertisement.
If you liked this content on beToken my Friend, why don't you share it?